Splunk, SIEM, Log Analysis: Hands-on walkthrough of log ingestion, SPL querying, and basic security investigation using Splunk.
Keywords: Splunk, SIEM, Log Analysis, SOC, Threat Hunting, TryHackMe
Security monitoring is not just about collecting logs — it’s about turning raw machine data into actionable security insights.
In this hands-on walkthrough, I explored the fundamentals of Splunk, one of the most widely used SIEM platforms, through a practical lab exercise involving log ingestion and basic investigation queries. Instead of only covering theory, this walkthrough focuses on what we actually did, why we did it, and how Splunk helps security analysts investigate events efficiently.
Lab Link: https://tryhackme.com/room/splunk101
What is Splunk?
Splunk is a SIEM (Security Information and Event Management) platform that helps security teams:
- Collect logs from multiple sources
- Normalize and index machine data
- Search events efficiently
- Correlate security events
- Visualize trends and anomalies
- Accelerate incident detection and investigation
Think of it as a centralized visibility platform for your infrastructure.
Without SIEM tools, reviewing thousands of logs manually would be operationally painful.
Core Splunk Architecture
Splunk mainly operates using three core components.
1. Forwarder
The Forwarder acts as the log collector.
It is a lightweight agent installed on monitored systems that gathers logs and forwards them to Splunk.
Typical data sources include:
- Windows Event Logs
- Syslogs
- Web server logs
- Firewall logs
- Database logs
- Endpoint telemetry
Its lightweight nature ensures minimal performance impact on the host.
Answer from lab: Forwarder
2. Indexer
The Indexer is where the real processing happens.
Once data reaches the indexer:
- Raw logs are parsed
- Data is normalized
- Fields are extracted
- Events are indexed for fast searchability
Without indexing, searching through millions of events would be painfully slow.
3. Search Head
The Search Head is the analyst’s workspace.
This is where:
- Queries are written
- Investigations are performed
- Dashboards are built
- Visualizations are generated
Splunk uses SPL (Search Processing Language) for querying indexed data.
Connecting to the Lab
The lab environment provides a live Splunk instance.
After launching the machine, the dashboard becomes accessible via the provided IP.
At this point, the goal is not hunting threats yet — it’s simply getting familiar with the platform.
Navigating the Splunk Interface
When opening Splunk for the first time, several interface sections appear.
Top Navigation Bar
This provides administrative and operational controls:
- Messages
- Settings
- Activity
- Help
- Search
- App Switching
This is where analysts usually monitor running jobs and manage platform settings.
Apps Panel
Splunk is modular.
Different apps provide specialized functionality.
The default app is:
Search & Reporting
This is the primary workspace for analysts.
Explore Section
This section gives quick access to:
- Add Data
- Install Apps
- Documentation
This becomes especially useful during data onboarding.
Adding Data into Splunk
A SIEM without data is just an expensive dashboard.
Splunk supports ingestion from:
- Event logs
- Syslogs
- Web logs
- Network telemetry
- Custom files
- API-based sources
For this lab, we worked with VPN log data.
Collecting Data from Files
Inside Add Data, Splunk provides multiple ingestion methods.
The correct option for file-based collection is:
Monitor
Why?
Because this mode continuously watches files or ports and ingests incoming data automatically.
Practical Log Ingestion
We uploaded the provided VPN log dataset.
Splunk ingestion follows a structured workflow:
Step 1 — Select Source
Choose the log file.
This tells Splunk what raw data needs processing.
Step 2 — Select Source Type
This defines how Splunk interprets the incoming data.
Examples:
- Syslog
- JSON
- CSV
- Windows logs
Choosing the correct type matters because field extraction depends on it.
Step 3 — Input Settings
Here we configured:
- Index Name → vpn_logs
- Host metadata
The index acts like a searchable storage bucket.
Step 4 — Review
Always validate configurations before ingestion.
Incorrect source parsing can break field extraction later.
Step 5 — Done
Splunk processes the file and indexes the events.
Now the investigation phase begins.
Investigation Queries
Now comes the fun part.
Instead of manually opening raw logs, we query structured event data.
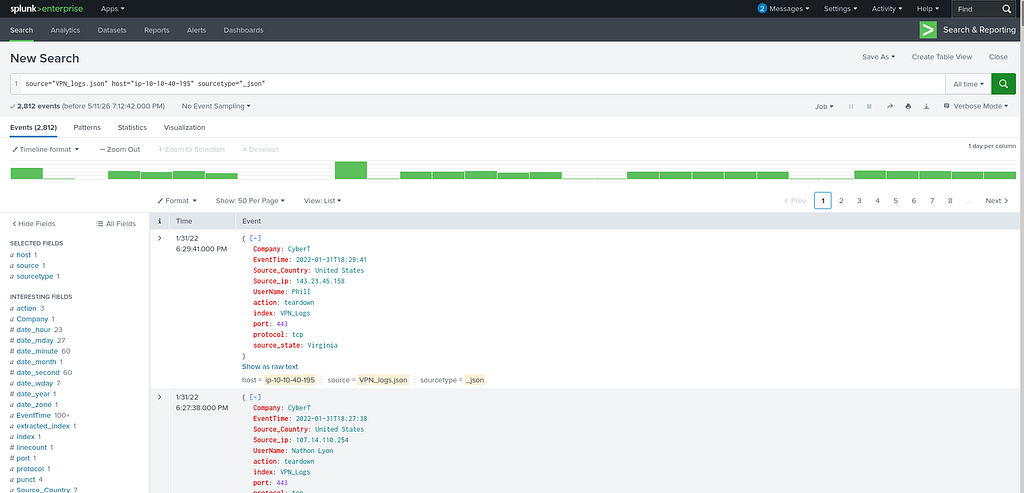
1. Total Number of Events
Objective:
Determine how many events exist in the uploaded dataset.
PAYLOAD
source="VPN_logs.json" host="ip-10-10-40-195" sourcetype="_json"
Why this works
This tells Splunk:
Search everything inside the VPN_logs index.
Since no filters are applied, Splunk returns all indexed events.
Result
2862 events
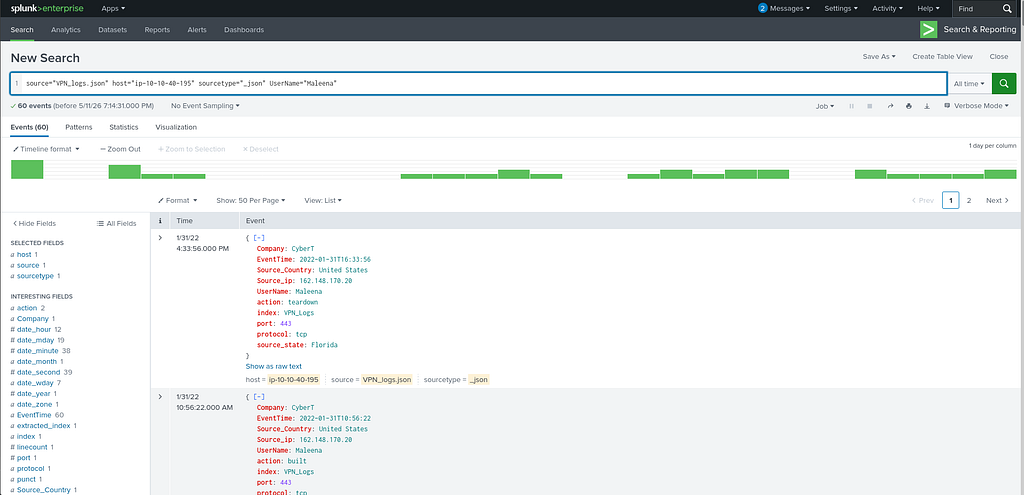
2. Events Generated by User “Maleena”
Objective:
Identify all VPN activity associated with a specific user.
PAYLOAD
source="VPN_logs.json" host="ip-10-10-40-195" sourcetype="_json" UserName="Maleena"
Why this works
This query:
- Searches inside vpn_logs
- Filters only events where UserName equals Maleena
This is useful during user-centric investigations.
Examples:
- Insider threat reviews
- Suspicious account monitoring
- Login activity auditing
Result
60 events
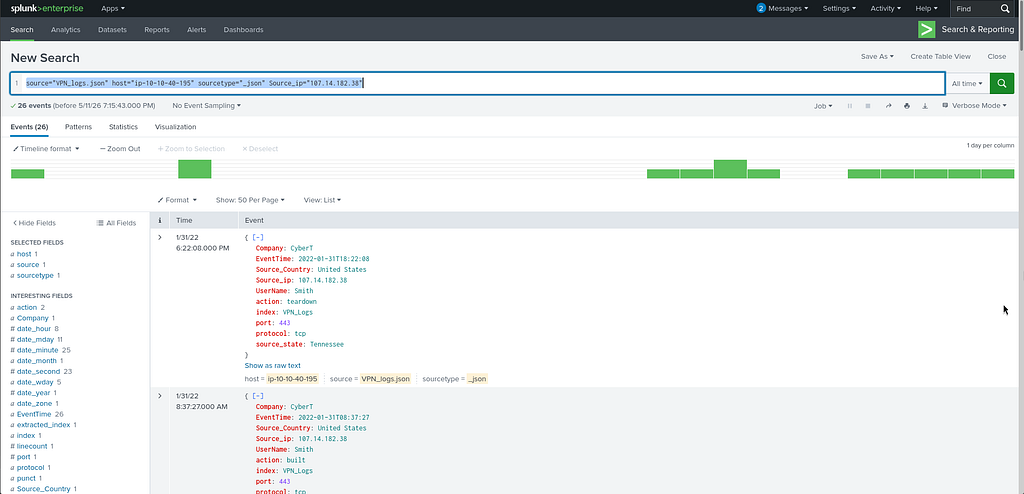
3. Identify Username Behind an IP Address
Objective:
Map an IP address back to a user identity.
PAYLOAD
source="VPN_logs.json" host="ip-10-10-40-195" sourcetype="_json" Source_ip="107.14.182.38"
Why this works
This filters events originating from the specified source IP.
This is common during incident response when an IP is flagged externally and analysts need attribution.
Result
Smith
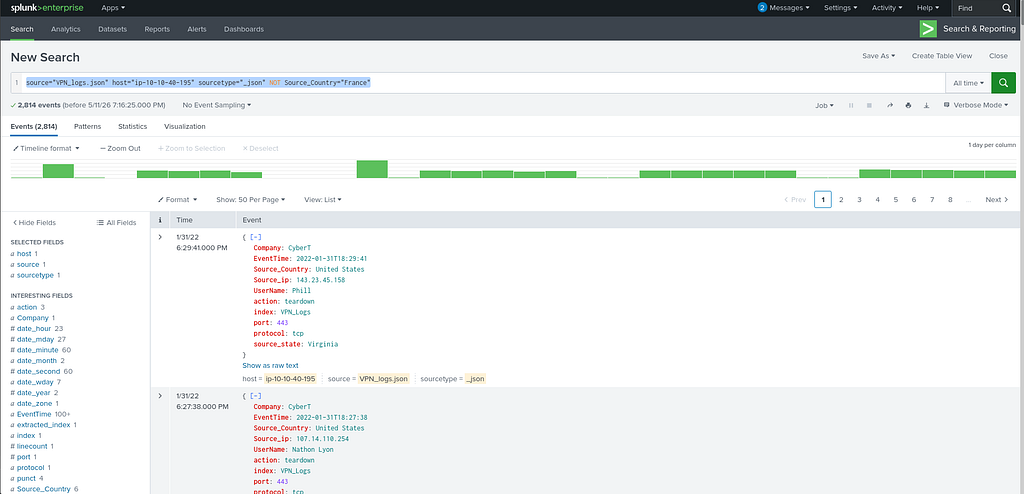
4. Events from All Countries Except France
Objective:
Exclude one geography from the search.
PAYLOAD
source="VPN_logs.json" host="ip-10-10-40-195" sourcetype="_json" NOT Source_Country="France"
Why this works
The NOT operator removes all events matching the specified condition.
This is useful when:
- Filtering known benign traffic
- Narrowing investigations
- Removing noise
Result
2814 events
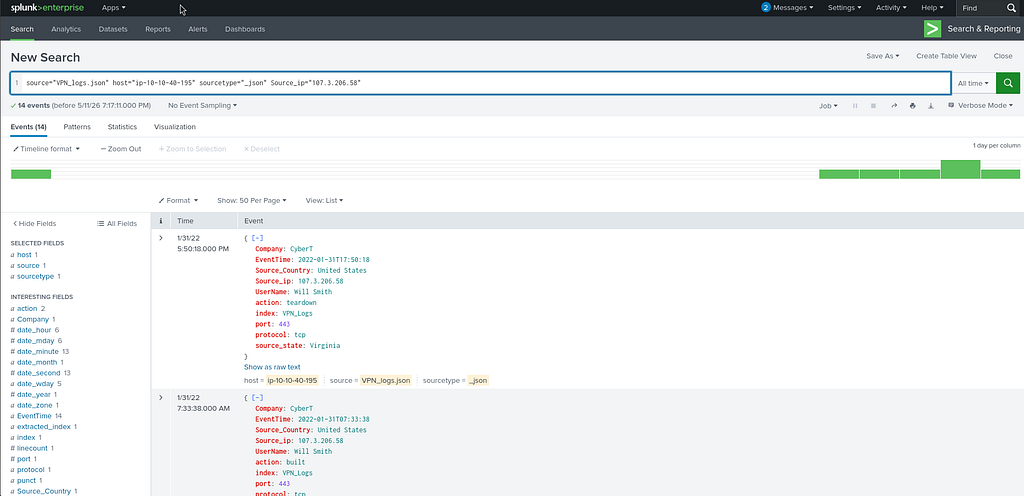
5. Activity from a Specific IP
Objective:
Check all events tied to a suspicious IP.
PAYLOAD
source="VPN_logs.json" host="ip-10-10-40-195" sourcetype="_json" Source_ip="107.3.206.58"
Why this works
This isolates activity from one host.
This helps in:
- IOC investigations
- VPN misuse analysis
- Threat actor tracking
Result
14 events
Key Splunk Concepts Learned
This exercise reinforces several foundational SIEM concepts:
Log Ingestion
Security visibility starts with proper onboarding.
No data = no detection.
Indexing
Raw logs become searchable events after parsing and indexing.
SPL Querying
Analysts use SPL to rapidly hunt across large datasets.
Filtering and Investigation
Instead of reading logs manually, we ask focused questions:
- Who logged in?
- From where?
- How often?
- Any anomalies?
Why This Matters in Real SOC Work
Even though this is a beginner lab, the workflow mirrors real-world analyst activity.
A SOC analyst frequently:
- Investigates suspicious IPs
- Reviews user login activity
- Filters noise
- Hunts indicators of compromise
- Correlates events across datasets
Splunk dramatically reduces investigation time compared to manual log review.
Final Thoughts
Splunk remains one of the most practical SIEM platforms for defenders because it combines:
- scalability
- fast search
- flexible parsing
- rich dashboards
- investigation speed
This lab was beginner-friendly, but it introduces the exact mindset needed for operational security monitoring.
Start with simple searches.
Then move toward:
- correlation rules
- alerting
- dashboards
- anomaly detection
- incident investigations
That’s where Splunk becomes truly powerful.
Splunk 101: Hands-On Introduction to SIEM, Log Ingestion, and Basic Threat Hunting was originally published in System Weakness on Medium, where people are continuing the conversation by highlighting and responding to this story.